Interactive image hotspots in p5.js with tack.
Build a clickable pixel-art train sketch in p5.js. Load polygon regions and placement points from tack. JSON, detect clicks with point-in-polygon, play sounds, swap sprites, and spawn particle smoke.
Last updated:
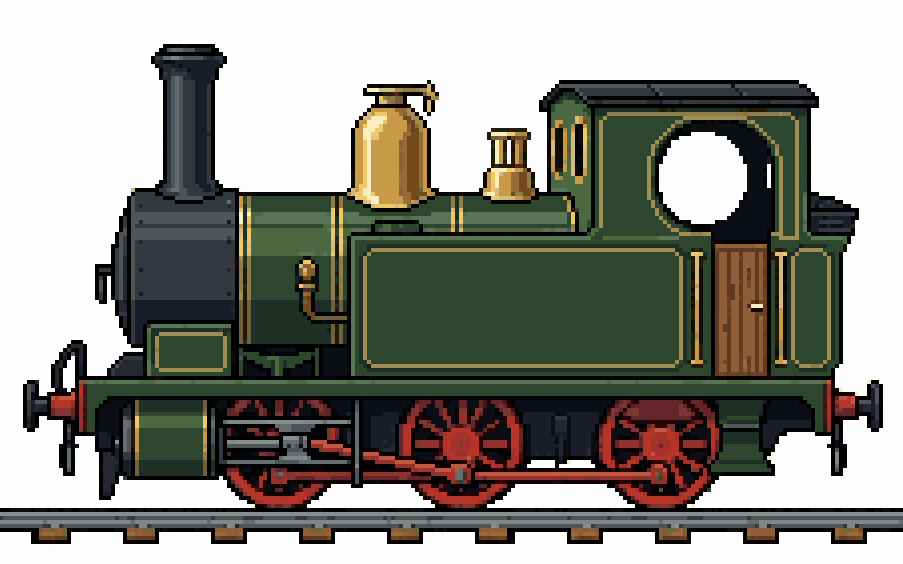
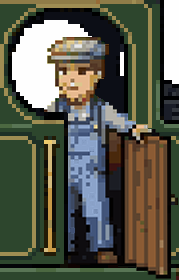
We’re going to build a small interactive p5.js sketch around a pixel-art steam locomotive. Click the brass whistle and it toots. Click the cab door and a friendly engineer appears, waving. Click the smokestack and a puff of pixel smoke drifts up out of the funnel.

The point of the exercise isn’t really the train. It’s that p5.js gives you a fantastic playground for responding to clicks, and tack. gives you a visual way to define where those clicks should matter — without typing a single coordinate by hand.
What you’ll learn
Three different ways to respond to a click, each one a useful pattern far beyond this sketch:
- Audio triggers —
loadSound()andplay(). The hello-world of interactive p5. - State toggles with placement anchors — flip a boolean and stamp a sprite at an exact pixel position pulled from your tack. data.
- Particle systems — spawn animated pixels from a click, give them a little physics, fade them out. Pure code, no extra asset.
You’ll also see the difference between two things tack. exports — polygons (regions where clicks happen) and points (single positions where things go). They’re related but they answer different questions, and once you have both in your toolbox you’ll find uses for them everywhere.
What you’ll need
- A basic p5.js sketch. If you’ve made one before — even just
ellipse(mouseX, mouseY, 50)in adraw()loop — you’re ready. - The two train images:
tutorial-train.png(door closed, the default state) andtutorial-train-driver.png(the door + engineer cut-out, drawn on top when the door is open). - A short whistle sound, saved as
whistle.wav. Freesound.org has plenty of CC0 steam whistles — anything around half a second works. - A tack. account. None needed; just open tack.pics.
Step 1 — Trace the regions in tack.
Load tutorial-train.png into tack. with Load Image. Set the coordinate system in the right-hand panel: Origin TL, Y-axis ↓, Units 0–1. Normalised coordinates make the JSON resolution-independent, which we’ll appreciate later.
You’ll trace four shapes — three polygons (the click regions) and one point (the cut-out anchor).

The three polygons
Press N for a new shape and click around each region in turn. Aim for tight but forgiving outlines — a 6–8 sided polygon is usually enough. Press C to close the shape when you’ve gone all the way around. Don’t worry about perfection; you can drag any anchor afterwards or insert new ones by clicking on a segment.
Trace these three:
- whistle — the small brass cylinder on top of the boiler dome
- door — the closed wooden door on the side of the cab
- smokestack — the tall black funnel near the front
If your tack. version supports renaming shapes, give them those names directly. If not, just remember the order — we’ll match by index later.
The point
Now place the anchor for the door cut-out. Press N for a new shape, but this time just click once — a single click with no drag creates a point shape, not a polygon.
The trick: zoom in hard — to about 800% — and click the exact pixel where the top-left corner of the cut-out PNG should land in the train image. That’s the same pixel the cut-out’s top-left corner occupied when you cropped it in Photoshop. Place the point there, and when p5 stamps the cut-out at that coordinate, it lands pixel-perfectly back where it came from.

Name this shape door_anchor.
Export
Open the Output panel, choose JSON, and click Download. Save the file as regions.json next to your sketch’s other assets.
The JSON looks like this (trimmed for readability):
{
  "image": "tutorial-train.png",
  "width": 1024,
  "height": 576,
  "origin": { "x": 0, "y": 0 },
  "yAxis": "down",
  "units": "norm",
  "shapes": [
    {
      "id": "shape_xxxx1",
      "label": "whistle",
      "type": "polygon",
      "closed": true,
      "points": [
        { "x": 0.42, "y": 0.18 },
        { "x": 0.46, "y": 0.18 },
        { "x": 0.46, "y": 0.27 },
        { "x": 0.42, "y": 0.27 }
      ]
    },
    {
      "id": "shape_xxxx2",
      "label": "door_anchor",
      "type": "point",
      "closed": false,
      "points": [
        { "x": 0.6914, "y": 0.2153 }
      ]
    }
  ]
}
Notice that points and polygons share the same points array — a point is just a shape with one entry and closed: false. That’s worth keeping in mind when we read the data.
Step 2 — Set up the sketch
Create an index.html and a sketch.js next to your assets. The HTML is the standard p5 boilerplate; the sketch starts like this:
let trainImage;
let doorOpenSprite;
let whistleSound;
let regionData;

let doorOpen = false;
let smokePuffs = [];

function preload() {
  trainImage     = loadImage('tutorial-train.png');
  doorOpenSprite = loadImage('tutorial-train-driver.png');
  whistleSound   = loadSound('whistle.wav');
  regionData     = loadJSON('regions.json');
}

function setup() {
  createCanvas(1024, 576);
  noSmooth();         // keep pixels crisp at any scale
  imageMode(CORNER);  // top-left placement, matches our anchor
}

function draw() {
  background(255);
  image(trainImage, 0, 0);
}
Open index.html. You should see the train. We’re going to build everything else on top of this base.
Step 3 — Helpers for reading shapes
The JSON puts everything in one shapes array, mixing polygons and points. Two helper functions let the rest of the code stay readable:
function findShape(label, type) {
  return regionData.shapes.find(s => s.label === label && s.type === type);
}

function getPolygonPx(label) {
  const s = findShape(label, 'polygon');
  if (!s) return null;
  return s.points.map(p => ({ x: p.x * width, y: p.y * height }));
}

function getPointPx(label) {
  const s = findShape(label, 'point');
  if (!s) return null;
  const p = s.points[0];
  return { x: p.x * width, y: p.y * height };
}
Both helpers convert the normalised 0–1 coordinates to pixel space by multiplying by width and height. Because our canvas matches the image, this gives us the exact pixel positions tack. recorded.
Step 4 — Hit detection
Detecting whether a point is inside a polygon uses an old, satisfying algorithm called ray casting. Imagine shooting a horizontal ray from the test point off to infinity. Count how many times the ray crosses an edge of the polygon. Odd means inside, even means outside. That’s it.
function pointInPolygon(px, py, poly) {
  let inside = false;
  for (let i = 0, j = poly.length - 1; i < poly.length; j = i++) {
    const xi = poly[i].x, yi = poly[i].y;
    const xj = poly[j].x, yj = poly[j].y;
    const intersect =
      ((yi > py) !== (yj > py)) &&
      (px < ((xj - xi) * (py - yi)) / (yj - yi) + xi);
    if (intersect) inside = !inside;
  }
  return inside;
}
Don’t worry about decoding it line by line. The intuition — odd crossings means inside — is the part worth remembering. The rest is just bookkeeping for “did this segment cross my horizontal ray?”
Now wire it to the mouse:
function mousePressed() {
  if (pointInPolygon(mouseX, mouseY, getPolygonPx('whistle'))) {
    whistleSound.play();
  }
  if (pointInPolygon(mouseX, mouseY, getPolygonPx('door'))) {
    doorOpen = !doorOpen;
  }
  if (pointInPolygon(mouseX, mouseY, getPolygonPx('smokestack'))) {
    spawnSmoke();
  }
}
Three lines, three different responses. Now we just need each one to actually do something.
Step 5 — The whistle
Already done. whistleSound.play() is the entire feature. Click the dome and you hear a toot.
If you want to be a little fancier, prevent overlapping plays with a guard:
if (!whistleSound.isPlaying()) whistleSound.play();
Step 6 — The door
This is where the point shines. When doorOpen is true, we draw the cut-out sprite at the anchor pixel — and because the anchor is the cut-out’s original top-left corner, it lands exactly where it came from in the original image.
Add this to the bottom of draw():
if (doorOpen) {
  const a = getPointPx('door_anchor');
  image(doorOpenSprite, a.x, a.y);
}
That’s it. The cut-out sits perfectly aligned with the rest of the train. No coordinate math, no tweaking, no nudging by one pixel and reloading. The point did the work.
This is the pattern you’ll come back to over and over once you start using points. Where does the speech bubble appear above this character? Where does the explosion spawn from this turret? Where is the pivot for this rotating windmill? Each of those is a tack. point.
Step 7 — The smokestack
Particles are pure p5 territory. We’ll make a tiny SmokePuff class — a position, a velocity, a size, a fading life — and spawn a handful each time the smokestack is clicked.
class SmokePuff {
  constructor(x, y) {
    this.x = x + random(-3, 3);
    this.y = y;
    this.vx = random(-0.3, 0.3);
    this.vy = random(-1.6, -0.9);
    this.size = random(8, 14);
    this.life = 255;
  }
  update() {
    this.x += this.vx;
    this.y += this.vy;
    this.size += 0.15;
    this.life -= 2.5;
  }
  draw() {
    noStroke();
    fill(220, 220, 220, this.life);
    rect(this.x, this.y, this.size, this.size);
  }
  isDead() {
    return this.life <= 0;
  }
}

function spawnSmoke() {
  const x = 0.18 * width;   // top of the funnel; eyeballed for now
  const y = 0.12 * height;
  for (let i = 0; i < 12; i++) {
    smokePuffs.push(new SmokePuff(x, y));
  }
}
We hardcoded the smoke origin to keep the focus on the technique. It’s an obvious next step to put a tack. point there and use getPointPx('smoke_origin') instead — see “What to try next”.
Now make the puffs animate, by adding this near the bottom of draw():
for (let i = smokePuffs.length - 1; i >= 0; i--) {
  smokePuffs[i].update();
  smokePuffs[i].draw();
  if (smokePuffs[i].isDead()) smokePuffs.splice(i, 1);
}
The reverse for loop is so we can splice out dead puffs without breaking the iteration. Click the smokestack a few times and watch them billow.
Step 8 — A debug overlay (optional but worth it)
Once everything works, you’ll probably want to see your polygons and points drawn on top of the train, so you can fine-tune them in tack. and reload. Add this to the end of draw():
const DEBUG = false;  // flip to true to visualise

if (DEBUG) {
  for (const s of regionData.shapes) {
    if (s.type === 'polygon') {
      noFill();
      stroke(255, 255, 0);
      beginShape();
      for (const p of s.points) vertex(p.x * width, p.y * height);
      endShape(CLOSE);
    } else if (s.type === 'point') {
      const p = s.points[0];
      stroke(255, 0, 255);
      strokeWeight(2);
      const x = p.x * width, y = p.y * height;
      line(x - 8, y, x + 8, y);
      line(x, y - 8, x, y + 8);
    }
  }
}
Flip DEBUG to true and your hotspots become visible. Flip it back when you’re done.
What to try next
You now have a sketch built around two ideas — regions where things happen and points where things go. Here are some places to take it:
- Move the smoke origin into tack. Add a point called
smoke_originat the top of the funnel and replace the hardcoded smoke coordinates withgetPointPx('smoke_origin'). Now you can re-aim it without touching code. - Animate the wave. Swap between two cut-outs of the engineer (arm up, arm down) every few frames while the door is open. A sprite sheet would work too.
- Add a label tooltip. When the mouse is over the whistle polygon, draw a little text label near the dome — anchored to a tack. point.
- Let people click the wheels. Trace each red wheel as a separate polygon and rotate them on click. (You’d need to draw them as separate sprites or as code-drawn circles.)
- A second engine. Trace a different image entirely, give it different sounds and sprites, and reuse the same code. Because the JSON drives everything, the same sketch can play any image you point it at.
The interesting thing is that none of these require new techniques. They’re all combinations of click a region and put something at a point — the two things you already know how to do.
If you build something with this, send a link — we’d love to feature reader sketches. And if you found a bug or have a feature request for tack. itself, the feedback channel is the same place.
Happy tacking. 🚂